MRI Physics: Tissue Contrast in MRI
This MRI simmulation illustrates the effects of changing TR and TE or introducing an inversion pulse (with time TI) on the appearance of a normal brain imaged with a fast spin-echo (FSE) sequence.
|
Presets: B0: 1.5T TR: ms TE: ms TI: ms |
T1 Weighting: % T2 Weighting: % PD Weighting: % |
Magnetic Resonance
We will briefly review magnetic resonance principles here, but you can find more details in the section on MRI pulse sequences.
First, let's review what an MR scanner actually measures - 'magnetic resonance.' A strong magnetic field is placed across the tissue along the direction of the bore of the magnet. This is referred to as B0. The magnetic moments within the tissue will tend to align towards B0, although because of molecular vibrations and collisions, they will remain mostly randomly distributed. After some time (4-5 times T1), the magnetic moments will reach an equilibrium with a small amount favoring the direction of B0. While magnetic resonance can apply to a large number of different atoms (or even molecules), in clinical MRI we are looking at the magnetic moments of the hydrogen nuclei, or protons, in the tissue. (Hydrogen is used because it has a very high abdundance, among other characteristics.)
The idea of resonance in MRI is the same as that in a violin string - a system can receive and return energy at certain specific frequencies, known as the resonant frequencies. In magnetic resonance, the resonant frequency is also known as the Larmor frequency and is determined by the gyromagnetic ratio γ of the particular magnetic moment (in this case, we are looking at the hydrogen nucleus, and γ = 42.58 MHz/T):
f = γ * B0
If you transmit energy into the system at the resonant frequency, you can change turn protons away from pointing along B0. After some time, these protons will 'relax' and give off energy to return to the lower energy state. This energy will be given off at the same frequency, and it is this signal that we measure.
In MRI, we are looking at the behavior of millions and millions of proton-magnets. The net direction of their moments is referred to as the net magnetization vector M. In equilibrium, since more protons are pointing along B0, M points in the direction of B0. This direction is typically referred to as the z-axis. There is no net polarization in the x- or y-axes. However, the protons actually rotate round that axis (known as precession), so that any one particular proton at any moment in time will be pointing in some direction in the xy plane.
The simplest version of an MRI sequence involves a so-called 90-degree pulse. This pulse of energy is exactly enough to rotate the protons 90 degrees, so the net magnetization is rotate from the z-axis, parallel to B0, into the xy-plane. At that point, Mz, the magnetization along B0, is 0.
Note that you can put in less energy to give a rotation of less than 90 degrees, which is often used in gradient-echo sequences. Alternatively, you may want to employ a 180-degree pulse to 'flip' the M vector into the -z direction; this pulse is twice as long (or strong) as the 90-degree pulse and is used for inversion recovery sequences, discussed below.
Just as a final note, realize that the MR scanner actually can only measure signal in the xy plane. That is, you cannot measure the Mz component of net magnetization. You have to flip M into the xy plane in order to measure its z-component.
T1
What happens after the pulse? Well, the system wants to return to equilibrium. There are two important equilibrium processes involved. The first we will discuss is T1, also known as spin-lattice relaxation. The 'lattice' simply refers to the surrounding material. Each proton must exchange its energy with the lattice in order to move back into equilibrium, parallel to B0. In order for the energy exchange to be efficient, it needs to be at the resonant frequency of the protons, just like with the energy pulse that the scanner sends. Thus, the 'natural frequencies of motion,' i.e. the speeds at which the protons in the tissue rotate, have to be similar to the Larmor frequency.
It turns out that pure water has a very wide distribution of natural rotation speed. Only a small fraction of water molecules at any given time are at the right speed for efficient energy exchange. It takes a long time for the water protons to relax, so the T1 of water is very long. If proteins are present, the water molecules will interact with them; since those molecules are so large, they slow down the water molecules and make the energy exchange more efficient. In fat, the protons are bound to long carbon chains, and the rotation of the carbon-carbon bonds is at a frequency close to the proton Larmor frequency; therefore, fat protons have a very efficient spin-lattice exchange and short T1.
How do we measure the effects of T1 relaxation? As mentioned above, the MR scanner can only measure xy magnetization. We have to flip the z component into the xy plane to measure it. Thus, how do we measure T1? Well, we flip the magnetization into the xy plane and wait for it to recover for some specified time. This is called the repetition time TR (you will see why), although you can think of it as the T1 recovery time. After this time, we flip the recovered magnetization into the xy plane, and then we measure it. To re-emphasize: we are measuring the amount of z-recovery (spin-lattice recovery) that has occurred after TR (by flipping it into the xy plane after the recovery).
Tissues with a fast T1 will have recovered the most signal in the TR time, so they will have the brightest signal. Tissues like water with poor spin-lattice energy exchange will have recovered the least signal (the fewest protons will have been able to flip back). Thus, they will have the darkest signal.
B0 strength and T1. Increasing the strength of the main magnetic field B0 increases the signal available from magnetic resonance by increasing the proportion of protons aligned to the magnetic field. (The energy difference between parallel and anti-parallel is greater, therefore more protons are aligned.) Many other parameters are affected when one increases the field strength. However, in this section we will discuss the effects on T1. Recall that T1 relies on efficient energy transfer between any proton and its surroundings; this requires the proton to be moving around at frequencies close to the resonant frequency. Increasing B0 increases the resonant frequency. Remember that in water-protein mixtures (which describes most natural tissue), the water molecules were moving at close to the Larmor frequency of hydrogen - they were slowed down by interacting with the proteins. However, when you increase the resonant frequency, now fewer water molecules are moving at that resonant frequency. Thus, in general, this tends to lengthen the T1 of tissue. The T1 of free water does not change much because of the wide distribution of rotation speeds in free water - only a small fraction of molecules will be near the resonant frequency of hydrogen, no matter what that frequency is.
Gadolinium Contrast
Currently, gadolinium chelates are the only widely used MR contrast medium. How do they work? Contrary to what you might expect, you are not imaging the gadolinium or even the protons in the chelate. The effect of the gadolinium is to alter the rotation frequency of water molecules, and it is still the water protons that contribute to signal. Remember that in the extracellular compartment (where gadolinium goes), you have water and proteins. Some of the water is interacting with protein and thus has a short T1. However, most of it is still 'free water' - not near any proteins and thus with a very long T1. The gadolinium has 7 unpaired electrons, which can interact with the water protons and alter their rotation, helping to exchange energy. Basically, this is the same mechanism as water interaction with proteins but just more efficient. Depending on the precise structure of the gadolinium chelate, the ability to bind water protons or the influence on rotation speed may be slightly different and thus the 'relaxivity' (efficacy) of different gadolinum contrast agents can be different. Gadolinum chelates also affect T2, see below.
T2* and T2
In addition to the longitudinal (Mz) recovery of the net magnetic moment, a second equilibrium process occurs after a 90 degree pulse: transverse (xy-plane) dephasing. Immediately after the 90-degree pulse, the protons appear to be in phase with each other in their precession about the main magnetic field B0. (This is because the small enrichment of protons pointing along B0 is now pointing in the xy-plane, and the entire system then begins to precess around B0 - that small excess of protons is initially in phase because it was simply rotated.) The protons then precess around B0 at the Larmor frequency f = γ * B. Notice that the precise frequency depends on the magnetic field felt by each proton. While the MR scanner imposes a relatively uniform magnetic field B0, the local environment of each proton is slightly different. Nearby protons act as small magnets and exert mild effects on their neighbors; ferromagnetic materials like iron create magnetic fields of their own; and tissue-air interfaces also contribute to inhomogeneity in the magnetic field.
T2*. For all of these reasons, each proton will precess at a slightly different frequency from its neighbors. Now, recall that the MR scanner measures the signal in the xy-plane only. This signal depends on all of the protons pointing in the same direction all the time. As protons speed up or slow down their frequencies because of the magnetic inhomogeneity, they will start pointing in many different directions. Thus, the net signal - the sum of these protons - becomes very small and eventually goes to zero.
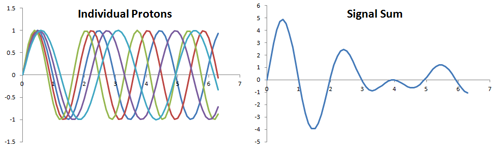
One component of the xy-plane signal from protons with slightly different frequencies. Each curve represents a different proton's signal over time. The sum represents the composite signal - as the protons get out of phase with each other, the net signal decreases.
The same phenomenon is illustrated in 2 dimensions. Each line represents the direction of a different proton precessing in the xy-plane. The thicker, orange line represents the net signal (sum of all 5 protons).
This dephasing phenomenon is referred to as T2*. In MR imaging, we separate T2* into two sub-effects: the dephasing caused by constant magnetic field inhomogeneities, such as effects of the scanner's field or local deposits of iron or air, and the dephasing caused by proton-proton interactions. The latter is a characteristic of the tissue itself and is referred to as T2.
The T2* dephasing is extremely rapid. This creates a problem because that means that a lot of our signal is gone (remember we can only measure the xy-signal) before we even have a chance to acquire the image. In order to obtain a better signal, we can create an echo of the xy-plane signal. This can be created with a 180-degree pulse to invert the direction of precession, which is used in spin-echo (SE) sequences; the advantage of the 180-degree pulse is that it also reverts the effects of the constant magnetic field inhomogeneities, and so we can measure T2. In a gradient echo (GRE) sequence, we do not use the 180 degree pulse. Thus, GRE does not compensate for inhomogeneities and so we keep the T2* effects. For further details, see the separate article on MRI pulse sequences. For our discussion here, you should know that TE represents the echo time - the time between the initial 90 degree pulse and the readout echo.
What affects T2 characteristics? Similarly to T1, the T2 characteristics of a tissue are strongly determined by molecular rotation speeds. T2 is often referred to as spin-spin relaxation because it involves the effects of one 'spin' (moving proton or electron) on another (proton). The presence of a neighboring electron or proton will influence the local magnetic field, as we mentioned before. If molecular rotation is very fast and distributed across a large range of velocities, the influence of neighbors will be rapidly changing. A proton pointing in one direction at one instant will be pointing an entirely different direction the next; overall, the effects will tend to cancel out. This is why free water has a very long T2 relaxation time. However, in solids or large molecules, motion is constrained; therefore, the neighboring protons or electrons will be pointing in the same direction for a long time. This will exert a bias on the local magnetic field, change the Larmor frequency of that proton, and thus contribute to T2 dephasing. This is why proteins and other solids have a very short (fast) T2 relaxation.
Fat. For complicated reasons (J-coupling, see MRI-q.com for a detailed discussion), fatty acids exhibit different T2 values depending on the type of sequence and timing. Specifically, in traditional spin-echo imaging, fat has an intermediate T2 value, but in fast spin-echo sequences, fat tends to be very bright on T2.
Gadolinium and proteins. As mentioned before, proteins themselves have a very short T2 value - too short to actually image. Their presence, however, will influence neighboring water molecules and speed water's T2 relaxation (again, by exerting a relatively constant magnetic field). Gadolinium similarly shortens T2 dephasing, especially in high concentrations.
What protons are imaged in MRI? As mentioned, large molecules have very short T2 and cannot be imaged. The main components of the MR signal come from fatty acids and water. Small molecules (e.g. lactate, amino acids) also contribute to the MR signal but are present in such small quantities that they are negligible. MR spectroscopy (MRS) measures the signal from these small molecules after suppressing the signal from fat and water. All of this explains why it is very hard to image mummies with MRI - they have no water!
Field strength. Field strength has minimal effects on T2. However, T2* (inhomogeneity) effects are greater at higher fields.
Inversion Recovery
Often in MR imaging, we want to subtract the signal of a certain substance that is irrelevant for the clinical question. For example, we may want to remove the fat signal from an image so that we can see edema better. There are several ways of doing this, but here we will discuss the method of inversion recovery. This represents the use of an additional 180-degree pulse applied before the 90-degree pulse used for tissue excitation. This pulse, termed the inversion pulse, flips the net magnetization into the -z direction. The magnetization then recovers just the same as with a 90-degree pulse. After waiting a certain amount of time TI, we then apply the 90 degree pulse to begin imaging. As the signal recovers from negative to positive, it must pass through zero. The time it takes to recover is determined by the T1 of each tissue; if we set the TI just right, we can apply the 90 degree pulse while some tissues have zero signal. The 90 degree pulse will then not affect them (because there is no net z-axis magnetization to flip into the xy-plane).
Many references will tell you that TI should be set to ln(2) * T1 = 0.693 * T1 to null the signal from a tissue with given T1. This is incorrect. As shown in the optional math - and as you can see in the diagram below - this gives a null value for the first inversion pulse only. The signal from this pulse is thrown away (just like the signal after the first 90 degree pulse in a spin-echo sequence). The true null time TI depends not only on the T1 of the tissue but also on the TR you are using (see the equation in the optional math for the exact relationship).
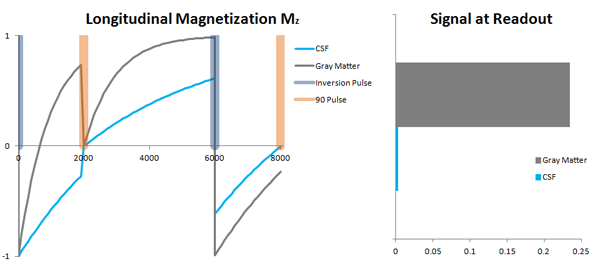
Illustration of an inversion-recovery sequence. Left: The net longitudinal magnetization over time. The TI is 2000 ms and the TR is 6000 ms. The results of the first 180-90 combination are thrown out since they are not at equilibrium. The second readout occurs at TI+TR = 8000 ms, and this represents the equilibrium values (all subsequent pulses will look like this one). Note that the signal from CSF is not nulled after the first TI but is 0 at the time of readout (Right).
T1 weighting. Inversion-recovery sequences are much more T1-weighted than standard spin-echo sequences. Why is this? You can see from the graph above that imaging (the 90-degree pulse) is performed at the inversion time, not after TR. The signal can only recover from its maximally negative value (created by the inversion pulse) for the TI time. Since TI < TR, the recovery is less - and shorter longitudinal recovery means more T1 weighting. (Negative numbers will get flipped to positive in the reconstruction.)
STIR. The short T1 inversion recovery (STIR) sequence is used for fat suppression in T2-weighted images. This has the advantage of not being dependent on the local magnetic field strength, as 'chemical' (frequency-selective) fat suppression is; the suppression just depends on the intrinsic T1 of fat. Fat has a very short T1, ~ 250 ms at 1.5T; the TI used is around 150 ms. Firstly, as noted, this will increase the T1 weighting of the image. However, the big disadvantage of STIR is that, because of this T1 weighting, the overall signal is much less (less time to recover longitudinal magnetization). With lower signal comes poor signal-to-noise, and often these sequences are run at poorer spatial resolution to compensate for this.
FLAIR. Fluid-attenuation inversion recovery (FLAIR) sequences are used in brain imaging to null the signal from the CSF. This provides a big advantage in T2-weighted images, especially in the periventricular regions where it can be difficult to see pathology near the bright CSF. Some institutions use T1-weighted FLAIR images instead of standard T1 spin-echo. Why would this be beneficial since CSF is not bright on T1-weighted images? As mentioned, the T1 weighting in an IR sequence is much greater than that achievable in standard spin-echo images. Thus, T1 FLAIR provides better T1 contrast than a standard T1 SE. The disadvantage of FLAIR images is that the T1 of CSF is very long, so very long TIs are required (~800 ms for T1 FLAIR or ~2000 ms for T2 FLAIR), necessitating very long TRs as well (~6000 ms for T2 FLAIR). This simply makes the imaging time long.
Things to Remember
- The tissue (image) contrast in MRI is determined by 3 things: density of 'mobile' protons, T1 characteristics, and T2 characteristics. Mobile protons basically mean fat and water protons; this number tends to be similar across different tissues. Solid materials like proteins or cortical bone have very few or no mobile protons.
- T1 characteristics are determined by the ability for protons to exchange energy with their environment. Protons in pure water are very poor at this; the presence of proteins or gadolinium chelates improves this exchange by slowing down the water molecules. Fat has a fast T1.
- T2* represents the process of dephasing - slight differences in local magnetic fields cause protons to move at different speeds and thus get out of phase with each other. T2* can be broken down into constant inhomogeneities (e.g. iron deposits or scanner magnetic field) and tissue-inherent characteristics, which are referred to as T2. Pure water has a very long T2 but the presence of proteins tends to shorten T2.
- Inversion recovery sequences can null - or subtract - the signal from tissues of a specified T1 value. They are longer and tend to have less signal than traditional sequences. However, they do have improved T1 contrast. The most well-known IR sequences are STIR (for fat suppression) and FLAIR (for CSF suppression in brain imaging).
References
- Hashemi, R. H., Bradley, W. G. & Lisanti, C. J. MRI: the basics. (Lippincott Williams & Wilkins, 2010).
- ReviseMRI.com
- MRI-q.com: Effects of B0 on T1 and T2 and Dipole-Dipole Interactions
- Korb JP and Bryant RG. "Magnetic Field Dependence of Proton Spin-Lattice Relaxation Times." Mag Reson Med 2002. 48: 21. Pubmed
- Wood ML and Hardy PA. "Proton relaxation enhancement." J Magn Reson Imaging 1993. 3(1): 149. Pubmed
- Elster AD. "An index system for comparative parameter weighting in MR imaging." J Comput Assist Tomogr. 1988 Jan-Feb;12(1):130-4. Pubmed
- Melhem ER, et al. "MR of the Spine with a Fast T1-Weighted Fluid-Attenuated Inversion Recovery Sequence." AJNR Am J Neuroradiol. 1997 Mar;18(3):447-54. Pubmed
Content and images copyright 2014 Mark Hammer. All rights reserved.